dsh-plugins-token-tracing-bundle
Verified@qihongmu/dsh-plugins-token-tracing-bundle · v0.1.1 · MIT
Aggregate install bundle for the token-tracing plugin: pulls the host/remotes/client halves and mounts all three with a single `dsh plugin add`.
Install
dsh plugin add @qihongmu/dsh-plugins-token-tracing-bundle Confirm the layer applied with dsh --profile default --dump-config — see the install guide.
Source
Published to npm without a public repository. Inspect the package contents before installing.
Readme
@qihongmu/dsh-plugins-token-tracing-bundle is the aggregate install bundle of the Token Tracing plugin — one command installs and mounts all three halves. This is the recommended install target.
Token Tracing
Token attribution for DeepSeek Harness: answers "where did the tokens go" — every LLM call in a conversation is traced as a span (user input, system prompt, tool definitions, each tool result, reasoning, cache reads/writes), with a per-turn waterfall inside the conversation and a cross-session dashboard with actionable optimization hints. The DSH library itself is never modified.
Install
One command pulls all three halves (host service, remotes assembly, browser UI) via the aggregate bundle:
dsh plugin --profile web add @qihongmu/dsh-plugins-token-tracing-bundle
Verified against DeepSeek Harness dsh-v0.1.2-rc.1 — the repository root README carries the plugin ↔ dsh compatibility table. Prefer installing the bundle or the individual halves, not both; install the halves separately only for fine-grained control from a source checkout. Conversations that predate the install are backfilled automatically in the background after dsh web restarts — no waiting for data to accumulate.
Screenshots
| Token Trace tab (in a conversation) | Token dashboard (cross-session) |
|---|---|
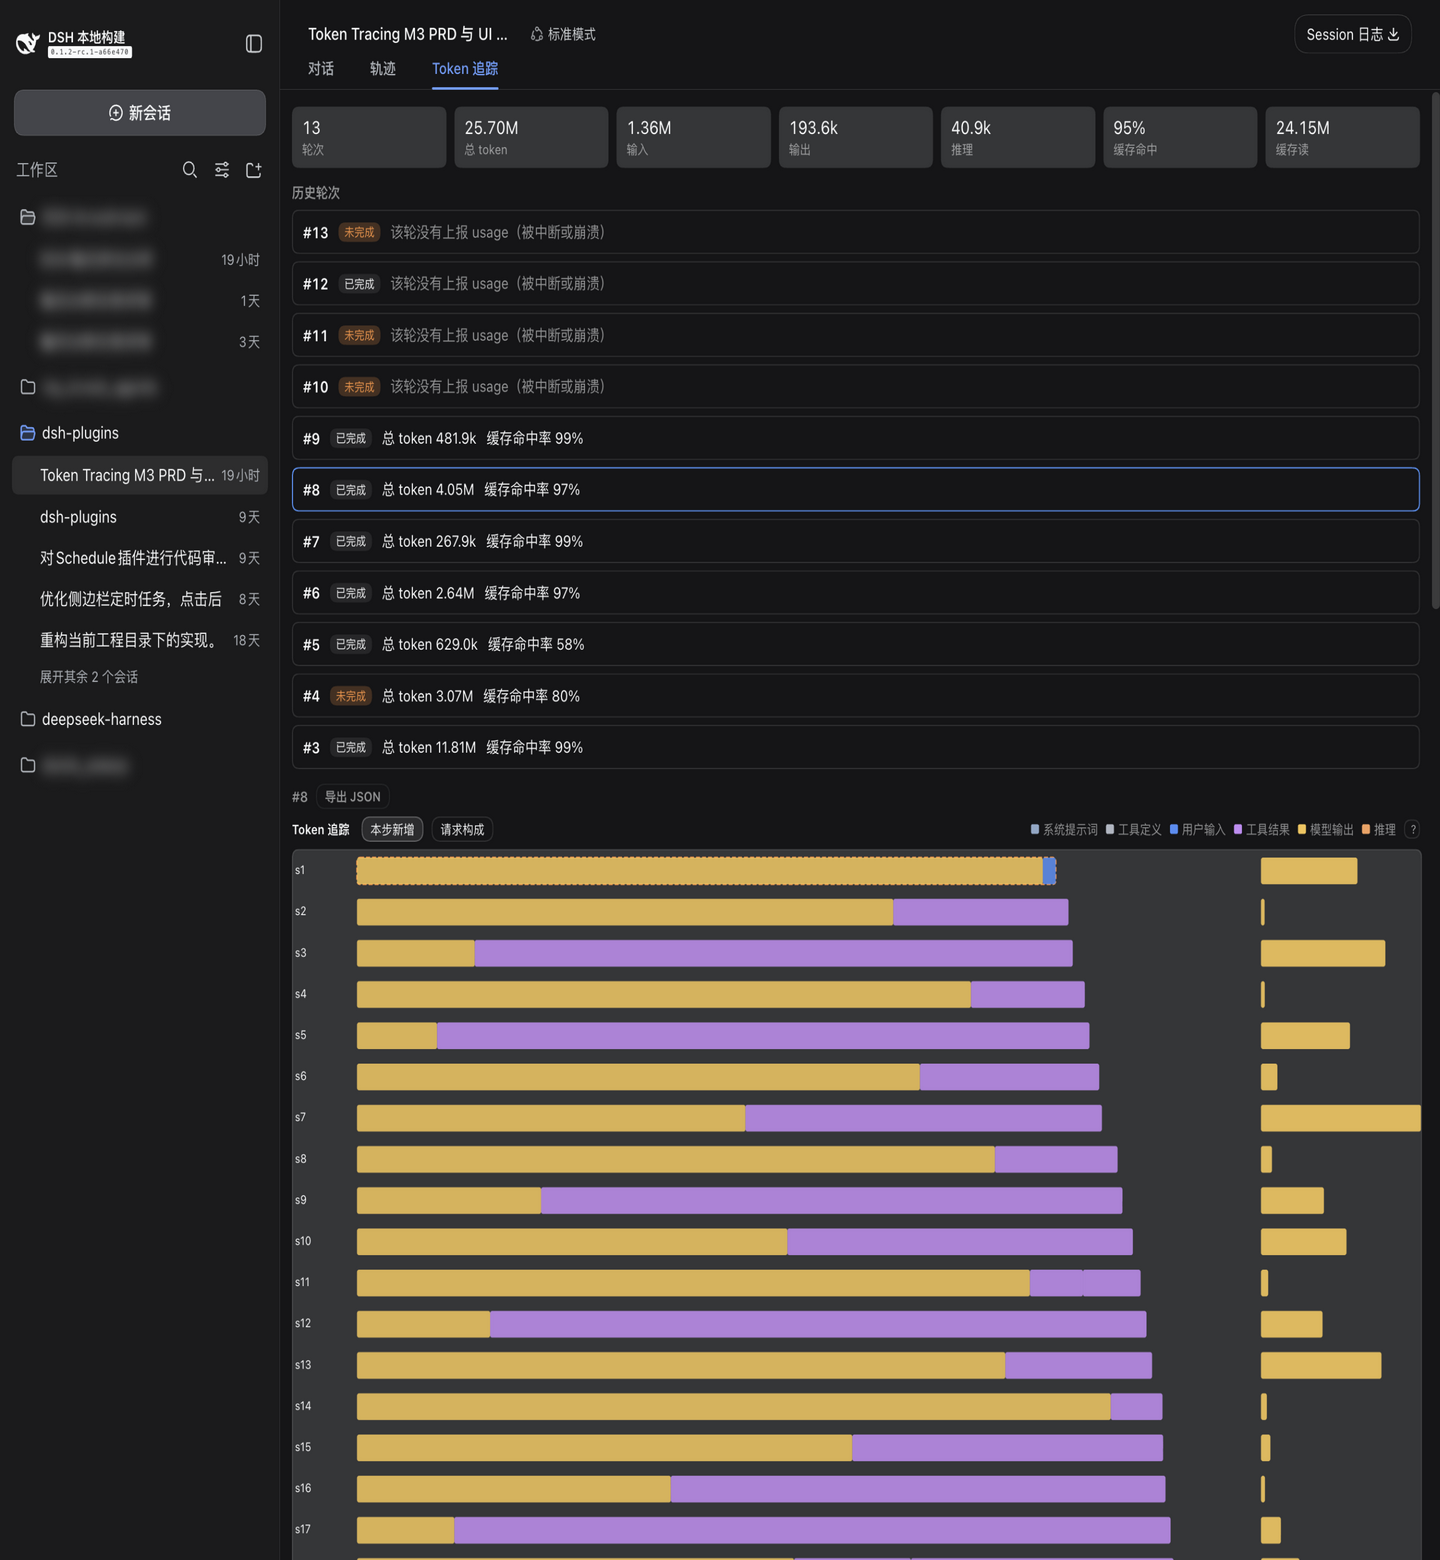 |
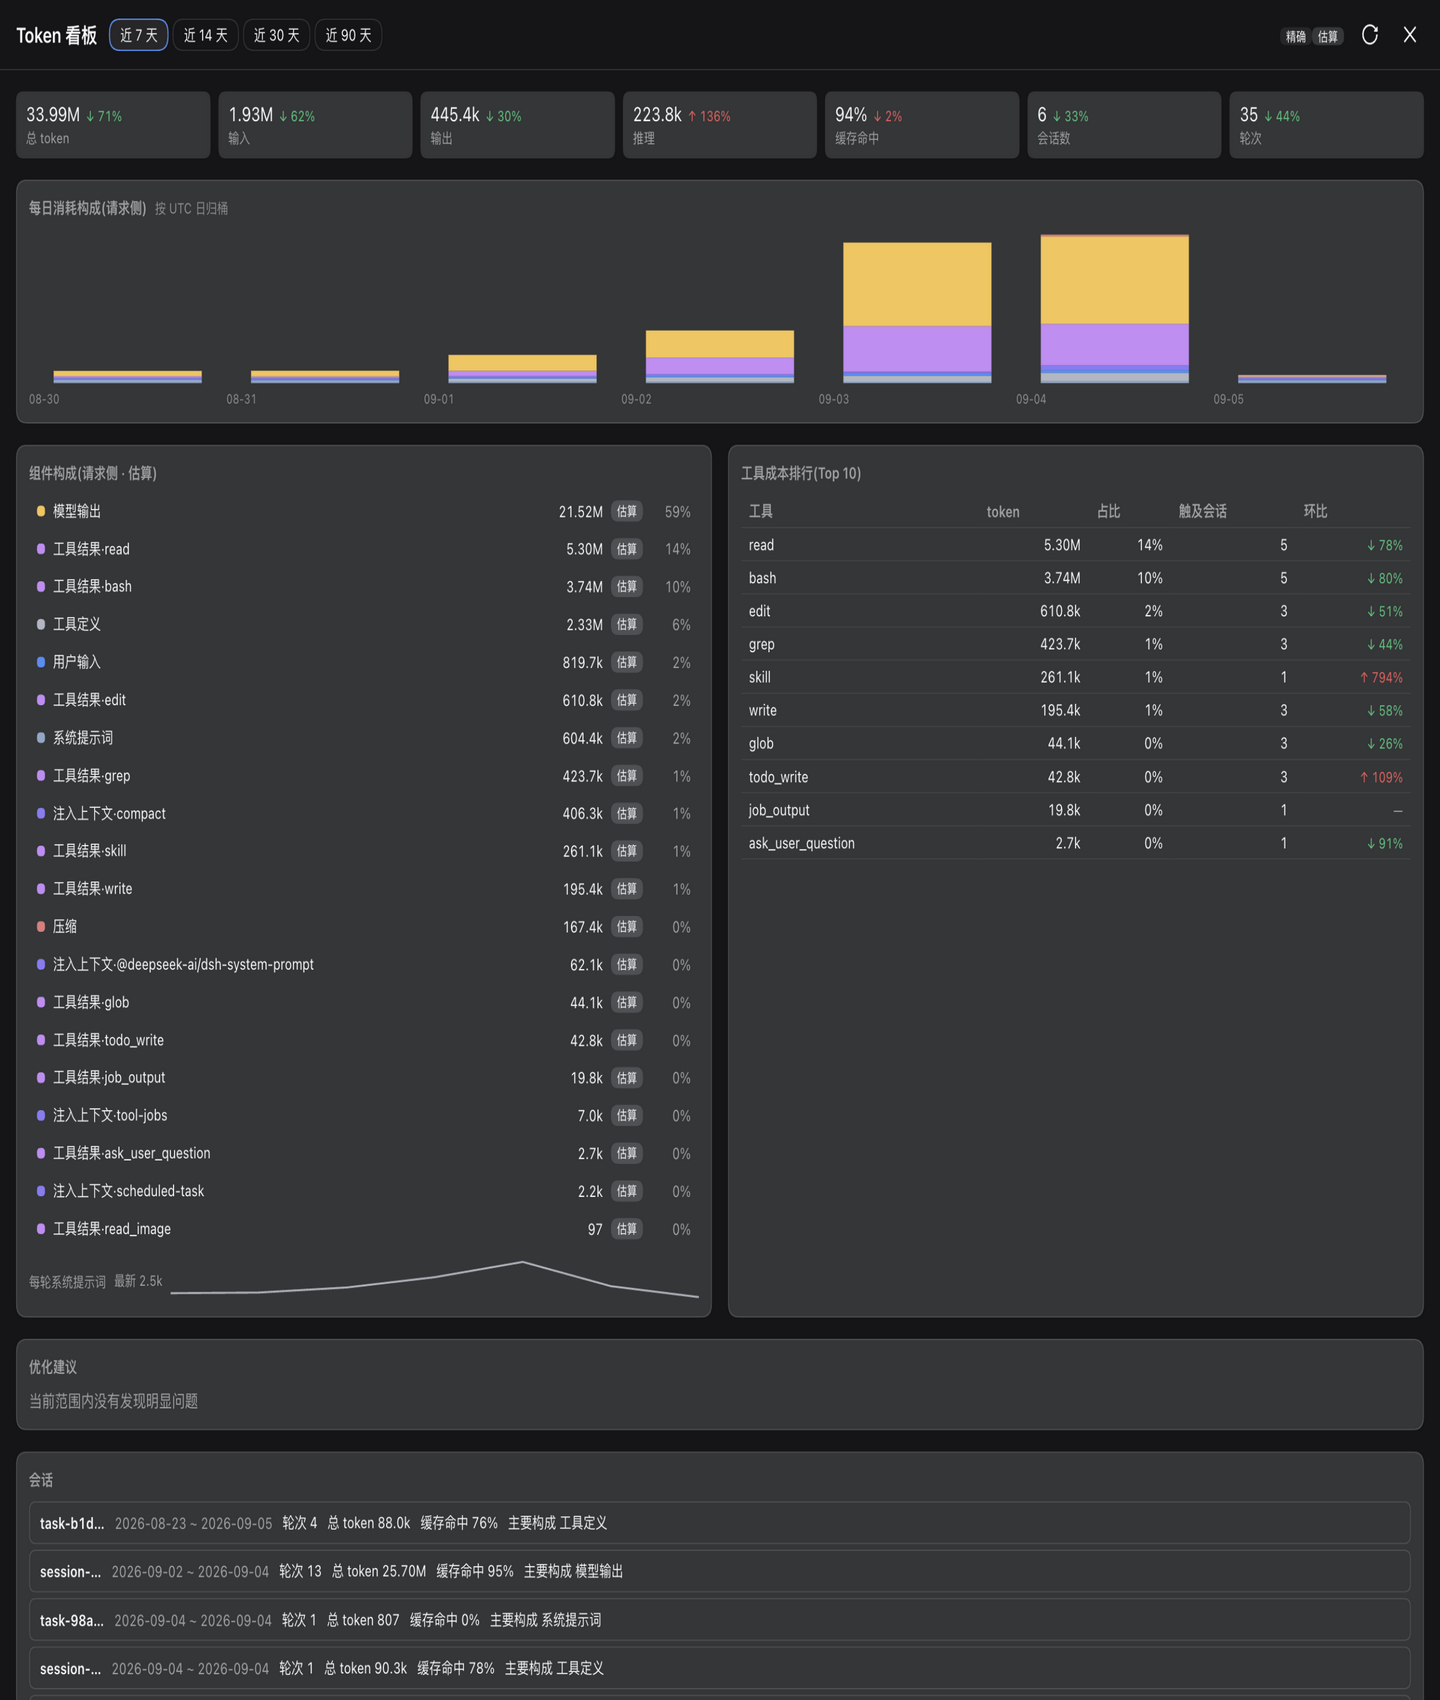 |
Unrelated session titles in the sidebar are blurred for privacy.
Where it appears
Two entry points; both follow the UI locale (English / 简体中文):
- Token Trace tab — inside any conversation, next to the built-in Trajectory tab.
- Token dashboard — a trigger in the sidebar footer opens a full-screen cross-session view.
Token Trace tab
- Summary bar — session totals for the six usage buckets (input, output, reasoning, cache read, cache write, total) plus the prefix-cache hit ratio; provider-reported, exact.
- Turn list — one row per turn (number, status, total). Selecting a turn opens its waterfall; Export JSON downloads the selected turn's trace for offline analysis.
- Waterfall — one row per LLM call, including retries and compaction passes:
- Increment view (default) — what this call added to the context: the previous output, each tool result, mid-turn injections. The added total is exact (the difference between consecutive prompt totals); its split across components is estimated.
- Composition view — the whole request: system prompt, tool definitions, conversation surface. Component sizes are calibrated estimates that always sum to the exact request total.
- Every figure is labeled exact or estimated. An ⚡ mark flags a cache invalidation (system prompt or tool set changed, or cache reads dropped); a compaction row shows what the summary replaced; interrupted turns render as incomplete with their missing totals shown honestly.
- Click a row for its detail panel: the six buckets, the component table, cache read/write, and basis badges.
Token dashboard
Full-screen view opened from the sidebar footer. Range chips select the last 7 / 14 / 30 / 90 days, each compared against the preceding period of the same length:
- Summary — totals and cache hit ratio with period-over-period deltas.
- Daily bars — tokens per day, stacked by component; click a day to filter the session list.
- Composition — each component's share of the range, plus the average system-prompt size per turn over time.
- Top tools — which tools' results cost the most tokens.
- Suggestions — actionable hints: a tool whose results dominate the context, turns that broke the prefix cache, a growing system prompt, results exceeding the 8k-token long-result threshold.
- Sessions — the sessions in range with per-day mini bars; expand one to scan for oversized tool results (explicit action, batched) and jump into the conversation.
How the numbers are earned
Providers report only aggregate usage per call — "exactly which component cost what" does not exist on the wire. The plugin layers three methods and never passes an estimate off as exact:
- exact — the provider-reported usage of each call.
- differenced — the total a call added is the exact difference between consecutive prompt totals within a series; only the split across components is estimated, by character share.
- calibrated estimate — component sizes estimated from character density, then scaled so they always sum to the exact request total.
Mixed figures always carry their basis badge, so the books always balance visibly.
Notes
- Storage — only per-session aggregates are persisted; turn details are recomputed on demand from the harness's own session logs. No copy of conversation content is made.
- Live — while a turn is running, updates stream into the tab; the dashboard reads on demand (manual refresh).
- Days are bucketed by UTC date.
- The built-in usage widgets (turn usage panel, stats line, context meter) are left untouched; no cost-in-currency conversion, and suggestions only inform — nothing is changed automatically.